
Home
Understand the key sales metrics and recent activity for orders and subscriptions on your Home dashboard.
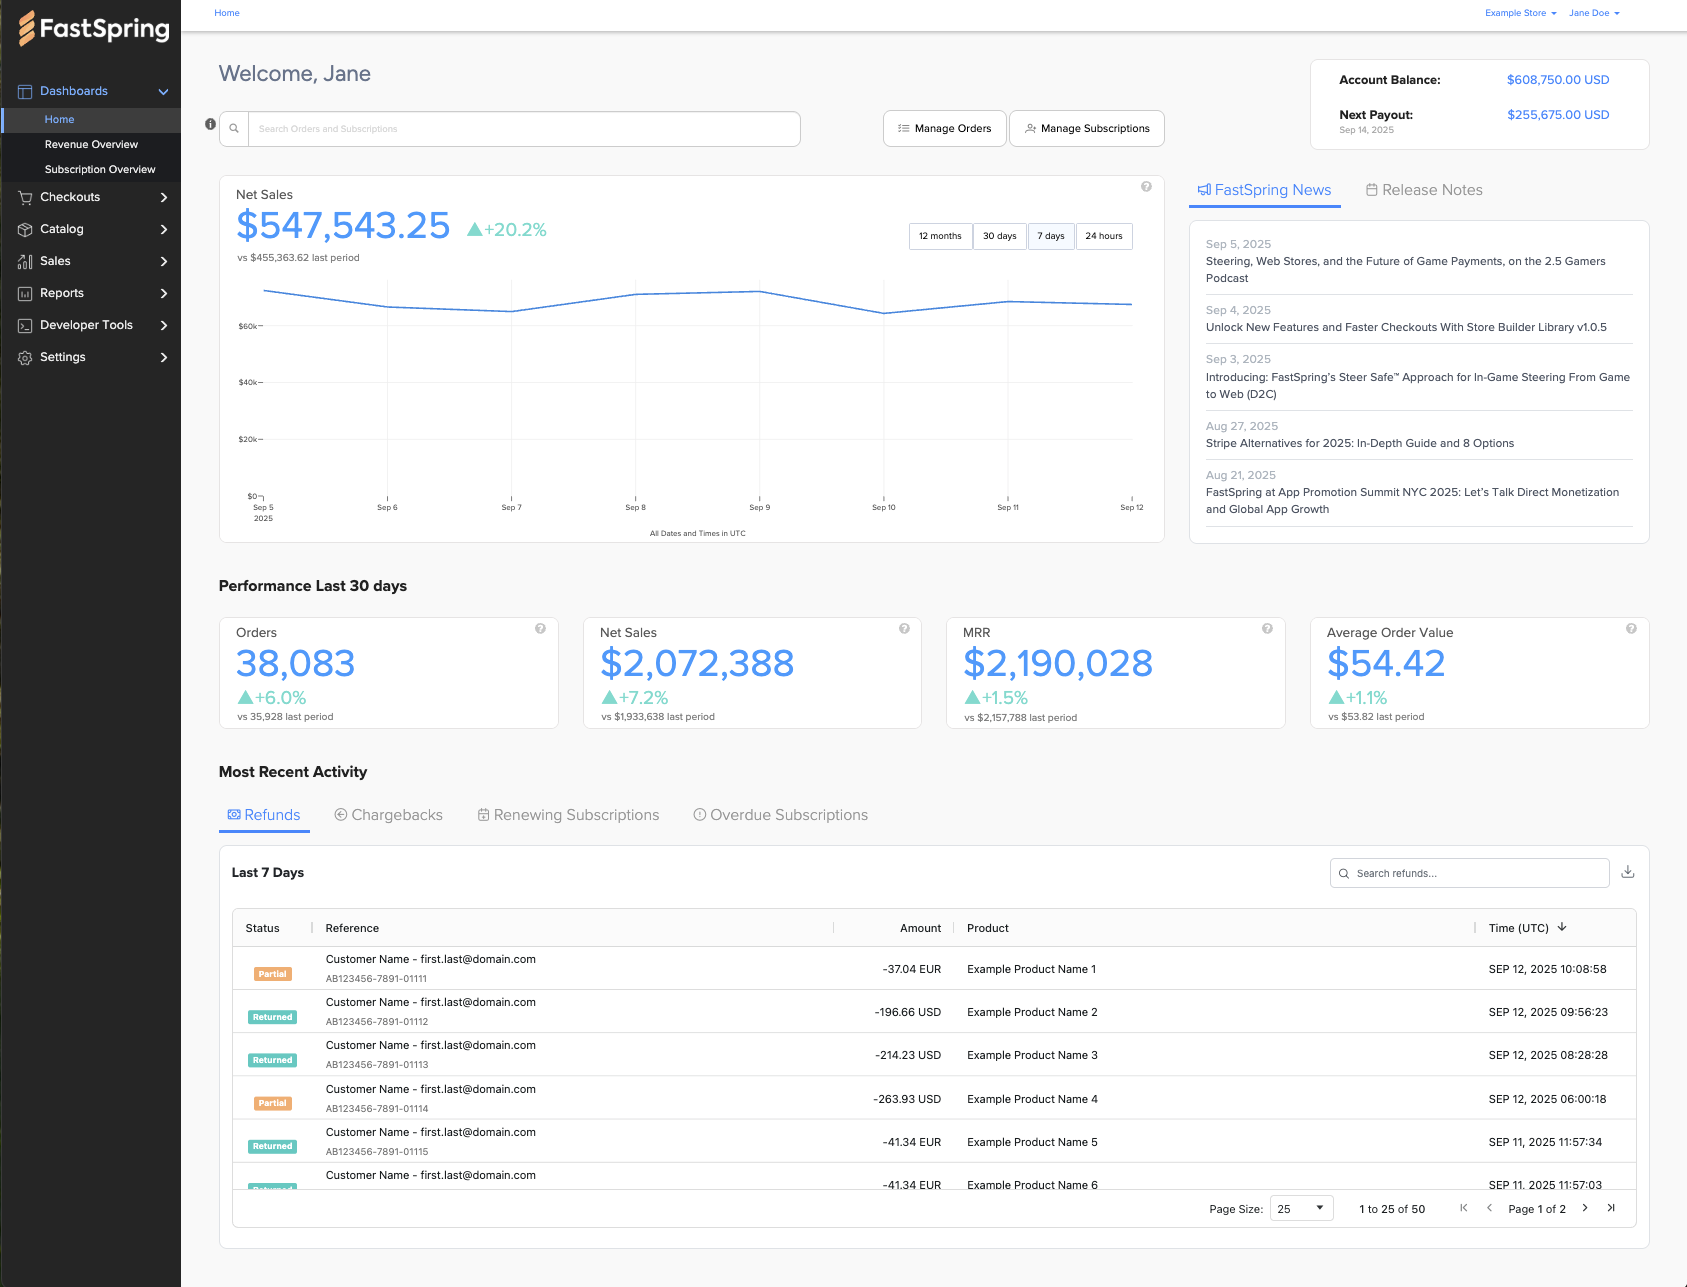
The Home dashboard is the first page you see when signing in to the FastSpring app. It provides a quick snapshot of your store's performance, recent activity, and account details. Use it for a high-level view before drilling down into the dedicated Revenue Overview or Subscription Overview dashboards.
Search and quick actions
At the top of the page, you will see a personalized welcome message and a global search bar. The search bar lets you find orders or subscriptions by ID or keyword. Search is case sensitive and supports the following formats for locating customers and transactions:
| Search Field | Example |
|---|---|
| Order or Subscription Reference | ABC123-123-123 |
| Customer Email Address | [email protected] or @abc.com |
| Customer Last Name | Andersen or Ande* |
| Customer Company Name | FastSpring or Fast* |
| Last 4 Digits of Credit Card | 4321 |
Tip: You can use a wildcard (
*) for partial matches in customer last names and company names. For example:Ande*orFast*.
Quick actions
In addition to search, you can jump directly into order and subscription management using the shortcut buttons located top-right:
- Manage Orders: Opens a list view where you can browse detailed order history.
- Manage Subscriptions: Opens a list view of subscription history with the option to drill down into subscription details.
Account and news
The right-hand side of the dashboard is dedicated to your account status and platform updates.
Displays the current available balance in your FastSpring account. Clicking this value opens the Account screen for more details.
Shows the scheduled payout amount and date. Clicking this value opens the Account Transactions screen.
This section helps you stay informed without leaving your workspace.
- FastSpring News: Includes product announcements, insights, and best practices.
- Release Notes: Summaries of recent updates and new features.
Revenue trends
The center of the dashboard is dedicated to the Net Sales chart, which provides a visual summary of recent revenue trends.
Visualizes revenue trends over the selected timeframe (12 months, 30 days, 7 days, or 24 hours). All dates and times are displayed in UTC.
Formula: Net Sales = Gross Sales – Refunds (excludes tax)
Navigation:
- Drill Down: Click the net sales total above the chart to open the Revenue Overview dashboard.
- Comparison: View the note beneath the chart to see performance against the previous period (e.g., "vs $10,200 last period").
If no data is available for the selected timeframe, the chart displays a placeholder message.
Performance last 30 days
Below the Net Sales chart, four performance cards summarize your store's activity over the last 30 days. Each card includes a mini-chart and links to a detailed dashboard.
Shows the total number of completed orders within the last 30 days. This includes subscription renewals but does not include refunds.
Navigation: Links to the Revenue Overview dashboard.
Displays net sales, calculated as gross sales minus refunds, excluding tax.
Formula: Gross Sales – Refunds (excludes tax)
Navigation: Links to the Revenue Overview dashboard.
Monthly Recurring Revenue. Compares current MRR with MRR as of 30 days ago.
Navigation: Links to the Subscription Overview dashboard.
Calculates the average revenue per order as net sales divided by the total number of orders. Refunds are included in this calculation.
Formula: Net Sales ÷ Orders (includes refunds)
Navigation: Links to the Revenue Overview dashboard.
Most recent activity
The lower portion of the Home dashboard gives you a quick view into refunds, chargebacks, and subscription activity from the past 7 days. This section is divided into four tabs: Refunds, Chargebacks, Renewing Subscriptions, and Overdue Subscriptions.
Tip: Each tab contains its own search bar and provides sortable columns. Each row in the activity tables is clickable and opens the related details page. You can also download a CSV export of the visible data using the download icon in the top-right corner of each table.
The Refunds tab displays the most recent refund transactions so you can verify refund requests and amounts. This view helps you confirm customer reimbursements separately from chargebacks. The table below lists the columns available in the Refunds tab.
| Column | Description |
|---|---|
| Status | The current state of the refund. |
| Reference | The unique ID for the refund transaction. |
| Amount | The refunded amount in the relevant currency. |
| Product | The product associated with the refund. |
| Time (UTC) | The timestamp when the refund was processed. |
The Chargebacks tab displays the most recent chargeback cases reported by payment processors. This view helps you track disputes that may impact net sales and understand when revenue is at risk. The table below lists the columns available in the Chargebacks tab.
| Column | Description |
|---|---|
| Status | The current state of the chargeback. |
| Reference | The unique ID for the related transaction. |
| Amount | The chargeback amount in the relevant currency. |
| Product | The product involved in the chargeback. |
| Payment Method | The payment method used for the original transaction. |
| Time Created (UTC) | The timestamp when the chargeback case was created. |
| Transaction Date | The original transaction date associated with the chargeback. |
The Renewing Subscriptions tab displays subscriptions that are scheduled to renew in the near term. This view helps you anticipate upcoming revenue and monitor active customers. The table below lists the columns available in the Renewing Subscriptions tab.
| Column | Description |
|---|---|
| Status | The current state of the subscription. |
| Reference | The unique ID for the subscription. |
| Amount | The renewal amount in the relevant currency. |
| Product | The product associated with the subscription. |
| Period | The subscription billing period. |
| Renewal Date | The date the subscription is scheduled to renew. |
The Overdue Subscriptions tab displays subscriptions with failed or delayed renewal payments. This view helps you identify customers who may need outreach and take proactive steps to reduce churn. The table below lists the columns available in the Overdue Subscriptions tab.
| Column | Description |
|---|---|
| Status | The current state of the subscription. |
| Reference | The unique ID for the subscription. |
| Amount | The overdue amount in the relevant currency. |
| Product | The product associated with the subscription. |
| Period | The subscription billing period. |
| Renewal Date | The date the subscription was scheduled to renew. |
| Attempts | The number of renewal attempts made. |
| Period Start | The start date of the subscription period. |
| Period End | The end date of the subscription period. |
FAQs
Why do I see 'No Data Available'?
This message may appear if your store is new, if the selected timeframe has no transactions, or if there is no matching activity. If no data is available for the selected timeframe, the chart displays a placeholder message.
What time zone does the dashboard use?
All timestamps and dates in the Home dashboard are displayed in UTC to maintain consistency across regions.
How often is dashboard data refreshed?
Data in the Home dashboard is updated continuously as transactions are processed.
Note: In some cases, updates may take up to 2 hours to appear after a transaction is completed.
Updated 6 months ago