
Trial Subscriptions Dashboard Documentation
On this page, you'll find a comprehensive reference to the metrics that FastSpring tracks and surfaces in your store's subscription trials dashboard. The definitions that follow explain the methodology and formulas that FastSpring uses in its subscription trials metric calculations, alongside example scenarios and charts that show the metrics in context.
Current Active Trials
Current Active Trials counts each unique, active trial subscription, as of the current date.
Methodology
- The Current Active Trials metric is always a positive number or 0.
- All trial types are included in the number.
- Applying dashboard filters doesn’t affect the total number.
Average Trial Days
Average Trial Days measures the average number of days a trial subscription is active, as of the current date.
Methodology
- Average Trial Days is always a positive number or 0.
- All active trial subscriptions and subscription types are included in the metric.
- Applying dashboard filters doesn’t affect the total number.
Lifetime Conversion Rate
Lifetime Conversion Rate shows the percentage of trial subscriptions that ended up converting, as of the current date.
Methodology
FastSpring uses the following formula to calculate Lifetime Conversion Rate:
Lifetime Conversion Rate = (Converted Trial Subscriptions / Total Trial Subscriptions)* 100
For example, if 100 trial subscriptions out of 500 converted, then Lifetime Conversion Rate would be 20% ([100/500] * 100).
FastSpring’s Lifetime Conversion Rate metric also factors in the following:
- Lifetime Conversion Rate is a percentage that is 0 or a positive number.
- All converted trial subscriptions and all trial types are included in the metric.
- Applying dashboard filters doesn’t affect the total number.
Lifetime Cancellation Rate
Lifetime Cancellation Rate shows the percentage of canceled trial subscriptions, as of the current date.
Methodology
FastSpring uses the following formula to calculate Lifetime Cancellation Rate:
Lifetime Cancellation Rate = (Canceled Trial Subscriptions / Total Trial Subscriptions)* 100
For example, if 200 trial subscriptions out of 500 were canceled, then Lifetime Conversion Rate would be 40% ([200/500] * 100).
FastSpring’s Lifetime Cancellation Rate metric also factors in the following:
- Lifetime Cancellation Rate is a percentage that is 0 or a positive number.
- All canceled trial subscriptions and all trial types are included in the metric.
- Applying dashboard filters doesn’t affect the total number.
Trial Signups
Trial Signups tracks the total number of activated trial subscriptions for a given day in a timeframe you select.
Keep the following in mind as you view the Trial Signups chart:
- Each trial type has its own line on the chart.
- Applying dashboard filters will change the chart’s metrics.
Example:
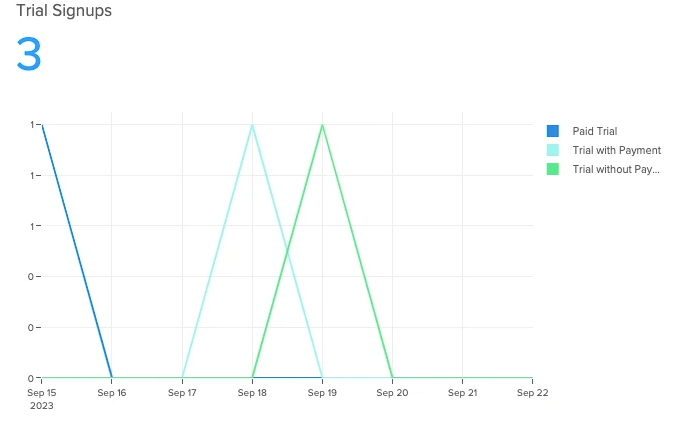
This Trial Signups chart shows the following:
- Between September 15th and September 22nd, there were 3 total signups.
- On September 15th, a paid trial subscription was activated.
- On September 18th, a free trial with payment method was activated.
- On September 19th, a free trial without payment was activated.
Trial Activations by Type
Trial Activations by Type breaks down the total number of all activated trial subscriptions by type over a time frame that you select.
Example:
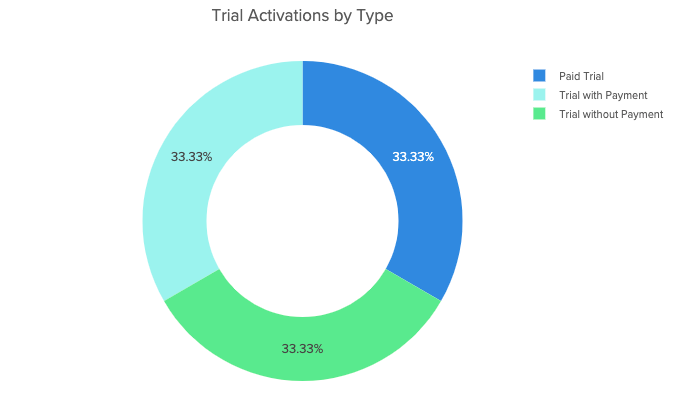
This Trial Activations by Type chart shows the following:
- Within the selected timeframe and filter(s), the same number of trial subscriptions was purchased for each trial type.
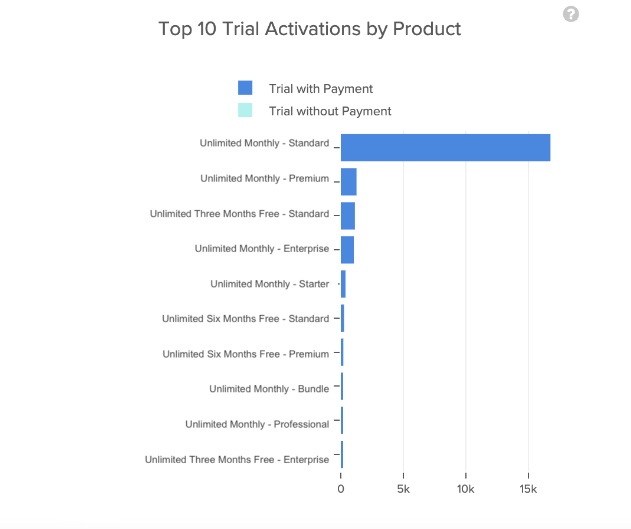
Top 10 Trial Activations by Product
The Top 10 Trial Activations by Type chart shows the top 10 activated trial types, listed from most to least activated, over a time frame you select.
Example:
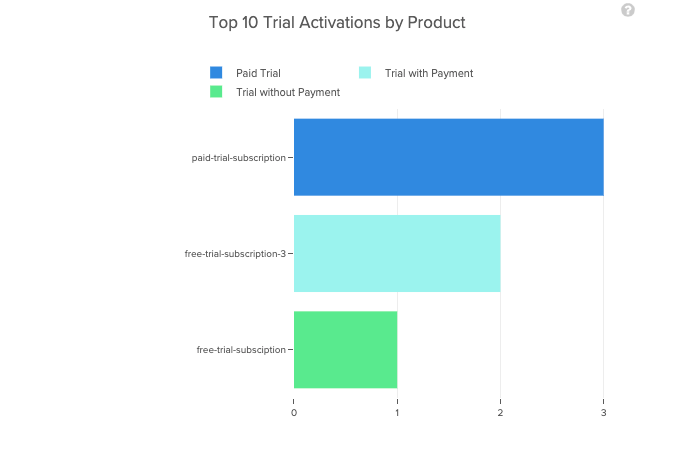
This Top 10 Trial Activations by Product chart shows the following:
- With the selected timeframe and filter(s), each trial subscription type was activated.
- Paid trials had the most activated subscriptions, with a total of 3.
- Free trials subscriptions were the least activated, with a total of one activation.
Trial Activations by Country
The Trial Activations by Country map shows the number of trial activations per country, over a time frame you select. The map includes all trial types.
The Trial Activations by Country chart shows the following:
- With the selected time frame and filter(s), the Americas had the most trial activations.
- No trial activations occurred in western Europe, though Russia had 1 trial activation.
Trial Cancellations for Prior 6 Months
Trial Cancellations for Prior 6 Months is a bar chart that shows total trial subscription cancellations over the previous six months, according to an end date that you select.
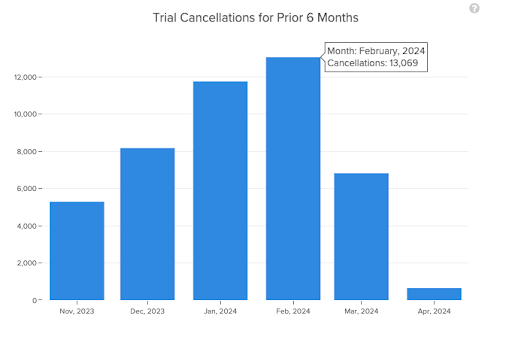
This Trial Cancellations for Prior 6 Months chart shows the following:
- November 2023 to February 2024 shows an increasing cancellation trend.
- February 2024 had the most canceled trial subscriptions, with 13069.
- April 2024 had the fewest trial cancellations.
Trial Conversions for Prior 6 Months
Trial Conversions for Prior 6 Months is a bar chart that shows total trial subscription conversions over the previous six months, according to an end date that you select
Example:
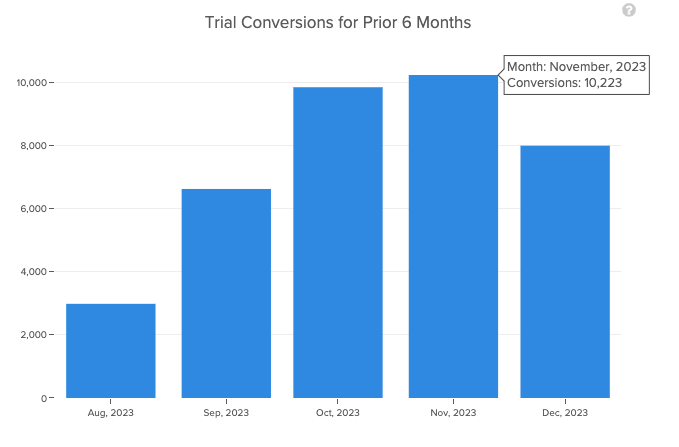
The Trial Conversions for Prior 6 Months chart shows the following:
- An overall increase in trial conversions occurred, likely as a result of higher customer satisfaction leading customers to convert trials into regular subscriptions.
- November 2023 had the most converted trial subscriptions, with 10223.
- August 2023 had the fewest trial conversions.
Trial Subscriptions Lifecycle
The Trial Subscriptions Lifecycle chart gives an overview of trial subscriptions at different stages in the trial lifecycle. This chart includes all trial types.
Example:
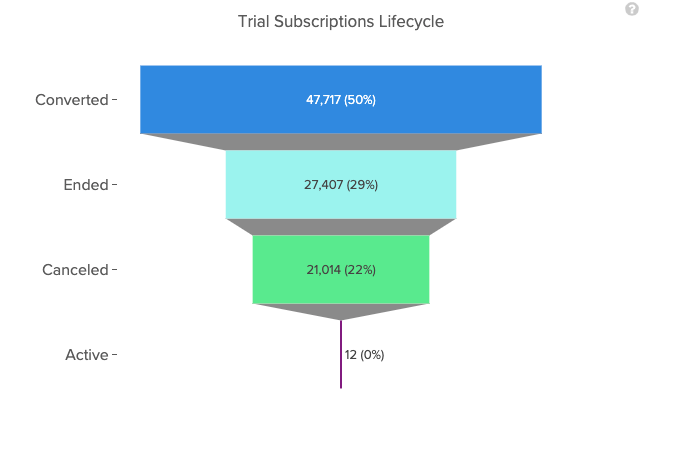
This Trial Subscriptions Lifecycle chart, covering a year of data, shows the following:
- Just under 50% of trial subscriptions converted.
- Just under 29% of trial subscriptions ended.
- Around 21% of trial subscriptions were canceled.
- The remaining 0.01% of subscriptions are still active.
Conversion Rate by Trial Type and Plan Term
The Conversion Rate by Trial Type and Plan Term chart shows a breakdown of converted trial subscriptions by trial type and plan term.
Example:
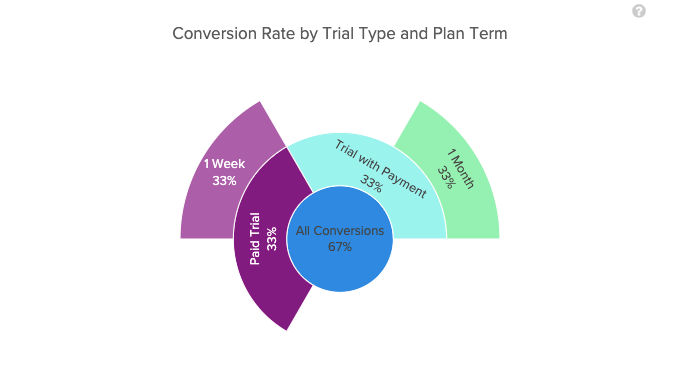
This Conversion Rate by Trial Type and Plan Term chart shows the following:
- The blue circle shows that 67% of trial subscriptions were ultimately converted.
- 33% of all conversions were from users who were on a paid trial, and 33% of all conversions were from users who were on a free trial with a payment method.
- All users who converted from a paid trial chose a weekly subscription, and all users who converted from a free trial with payment subscription chose a monthly subscription.
Updated 3 months ago